# Set the number of simulations
num_simulations <- 10000

# Initialize variables to keep track of wins when switching and staying
switch_wins <- 0
stay_wins <- 0

# Perform the simulations
for (i in 1:num_simulations) {
  # Create three doors with one car and two goats
  doors <- sample(c("car", "goat", "goat"))

  # Player's initial choice
  player_choice <- sample(1:3, 1)

  # Monty Hall reveals a goat behind one of the unchosen doors
  monty_reveals <- which(doors[-player_choice] == "goat")
  monty_reveals <- monty_reveals[1]  # Monty reveals the first goat he encounters

  # Determine the other unchosen door
  other_door <- setdiff(1:3, c(player_choice, monty_reveals))

  # Simulate switching doors
  switch_choice <- other_door[1]

  # Check if the player wins when switching
  if (doors[switch_choice] == "car") {
    switch_wins <- switch_wins + 1
  }

  # Check if the player wins when staying
  if (doors[player_choice] == "car") {
    stay_wins <- stay_wins + 1
  }
}

# Calculate win percentages
switch_win_percent <- (switch_wins / num_simulations) * 100
stay_win_percent <- (stay_wins / num_simulations) * 100The Monty Hall problem is a famous probability puzzle. In this scenario, a contestant on a game show is presented with three doors. Behind one door, there is a car, while behind the other two, there are goats. The contestant chooses one door, and then the host, Monty Hall, who knows what is behind each door, opens one of the remaining two doors to reveal a goat.
The contestant is then faced with a choice: stick with their initial choice or switch to the other unopened door. What should the contestant do to maximize their chances of winning the car?
Simulation in R Let’s use R to simulate this problem and analyze the results.
Now, let’s create a more visually appealing plot to display the results:
library(ggplot2)Warning: il pacchetto 'ggplot2' è stato creato con R versione 4.3.3library(ggsci)
p <- ggplot(data.frame(Strategy = c("Switch", "Stay"), Win_Percentage = c(switch_win_percent, stay_win_percent)), aes(x = Strategy, y = Win_Percentage)) +
geom_bar(stat = "identity", fill = c("lightblue", "papayawhip")) +
labs(title = "Win Percentage in Monty Hall Problem",
x = "Strategy",
y = "Win Percentage (%)") +
theme_minimal()
print(p)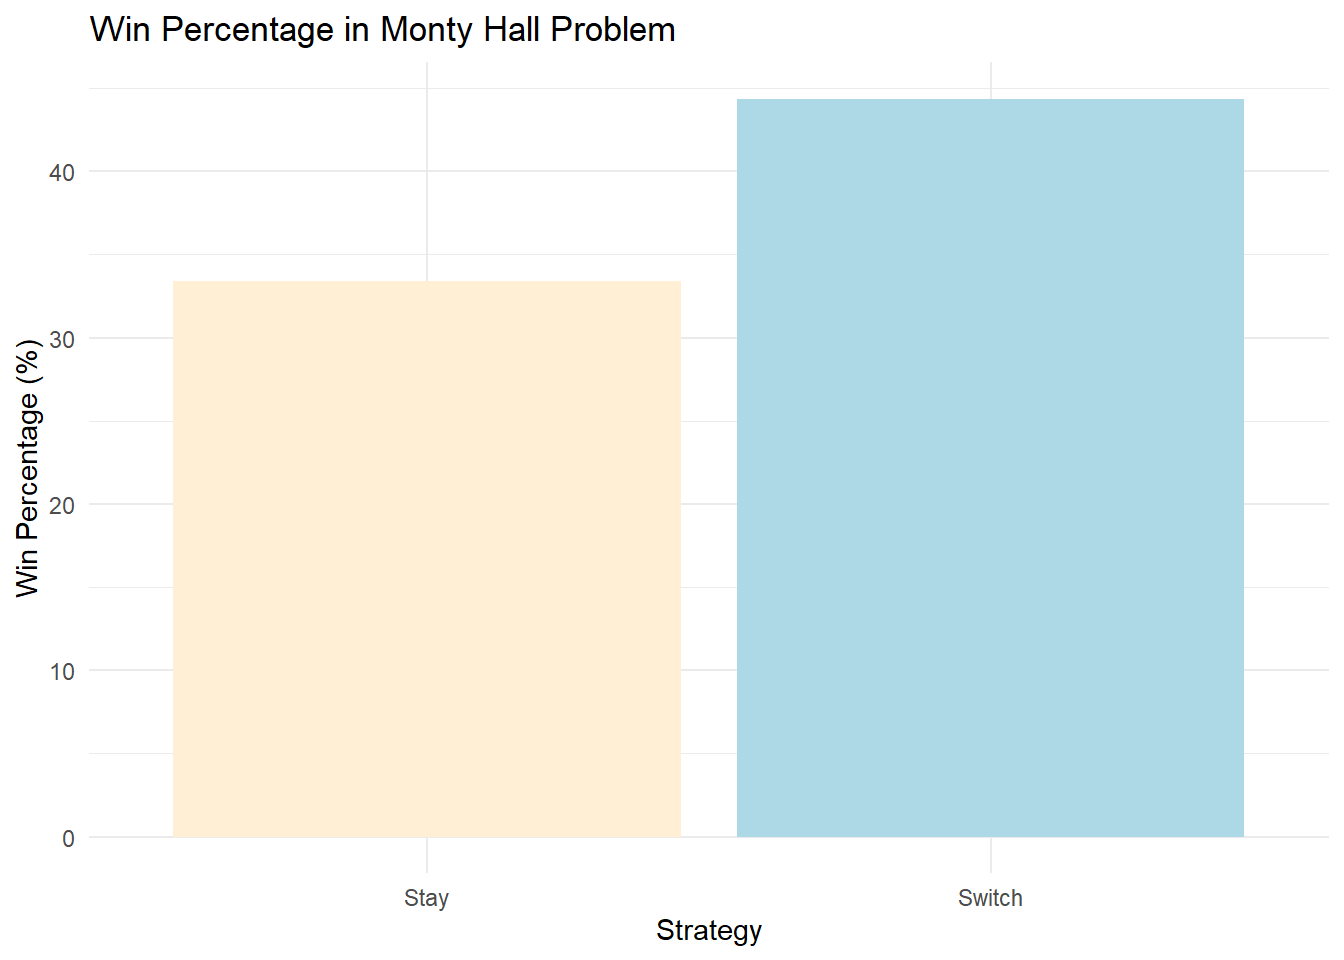
In this simulation, we ran 10,000 scenarios of the Monty Hall problem and recorded the results. As the bar plot illustrates, the win percentage is typically higher when switching doors compared to staying with the initial choice.
References
Dickey, James, N. T. Gridgeman, M. C. S. Kingsley, I. J. Good, James E. Carlson, Daniel Gianola, Michael H. Kutner, and Steve Selvin. 1975. “Letters to the Editor.” The American Statistician 29 (3): 131–34. http://www.jstor.org/stable/2683443.